How to Test Soundproofing With a Meter, Before and After
Working out how to test soundproofing comes down to one number: how many decibels quieter the far room is than the noisy one, measured the same way before and after the work.
A single reading can’t tell you that, because it rises and falls with the TV’s volume, the traffic outside and whichever phone app happened to be installed.
Measure the gap between two rooms with a steady test sound instead, and you’ll know whether the new door seal or the extra drywall earned its keep.
The method needs a speaker, a sound level meter or a carefully chosen app, and a notebook, and it follows the logic of the field tests acousticians run in finished buildings.
The test comes first, step by step, then the gear, what the numbers mean, how to find a leak and when a certified test is worth paying for.
How to Test Soundproofing Between Two Rooms
That before-and-after gap is called the noise reduction, and you can measure it anywhere in the house. To test soundproofing, play a steady, broadband noise in the louder room, read the level in that room and in the quieter room with the same meter, subtract the second number from the first, and repeat the whole routine the same way after the work.
The professional version works on the same principle. Intertek’s summary of the field method says the noise reduction is the difference between the space- and time-averaged levels in the two rooms while broadband noise plays in the source room (Intertek).
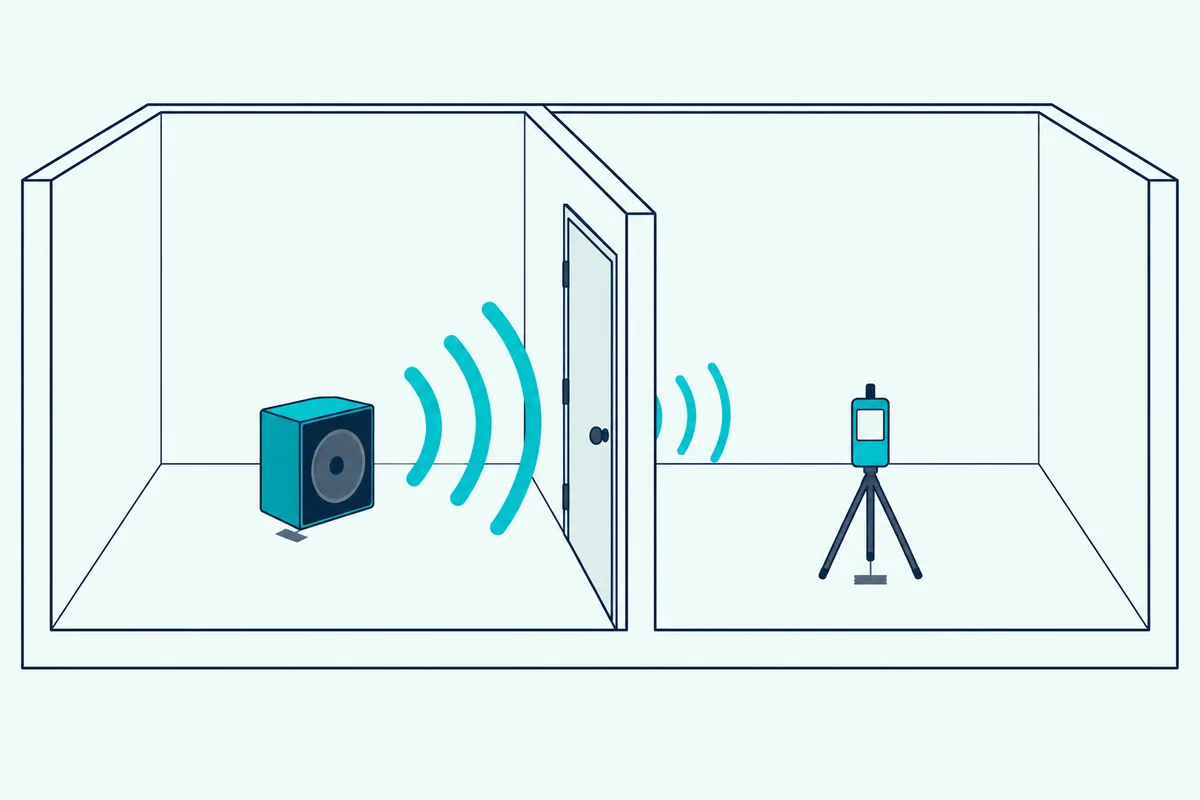
Get the conditions ready first, because they have to match on test day and on retest day:
- Close the same doors and windows both times, and switch off fans, appliances and the HVAC if you can.
- Leave the furniture, rugs and curtains where they are, since a fuller or barer room changes the reading.
- Mark the speaker’s spot and its volume setting, plus three or four meter spots in each room, with tape.
- Set the meter to A-weighting and to one response speed, fast or slow, and keep both settings for every reading.
Those marks matter more than any single piece of gear. Then run the test itself:
- In the quiet room, with the speaker off, note the background level.
- Play pink or white noise and turn it up until the quiet room reads at least 10 dB above that background.
- Read each marked spot in the loud room, then each spot in the quiet room, waiting for the number to settle.
- Average each room’s spots and subtract the quiet room’s average from the loud room’s.
Step out of the loud room between readings, since the test noise has to be loud to clear the background next door. Here’s how a page in your notebook might look for a bedroom wall, with illustrative numbers rather than a real result:
| Reading | Before the work | After the work |
|---|---|---|
| Background in the quiet room | 31 dBA | 31 dBA |
| Loud room average, test noise on | 84 dBA | 84 dBA |
| Quiet room average, test noise on | 50 dBA | 43 dBA |
| Noise reduction (loud minus quiet) | 34 dB | 41 dB |
In that example the wall improved by 7 dB, and both quiet-room readings sit more than 10 dB above the 31 dBA background. That background margin keeps the subtraction honest, for a reason the decibel math later in this guide makes clear.
What Do You Need to Measure Soundproofing?
That test asks for only three things: a steady sound source, a meter you can trust from one day to the next, and the discipline to use both the same way. To measure soundproofing at home you need a speaker that can play pink or white noise, a sound level meter (or a phone app with the limits below in mind), and a way to repeat the speaker’s position and volume exactly.
A broadband noise is the right test sound because it covers the whole range at once. NIOSH’s researchers played pink noise from 20 Hz to 20 kHz when they checked smartphone sound apps against a reference system, and Intertek describes the field method’s source as broadband noise (NIOSH via PMC).
Music and TV make poor test sounds, since their level changes from second to second. A speaker on a stand or a shelf is fine, as long as it goes back to the same mark every time.
Which Sound Level Meter Is Accurate Enough?
Meters come in classes, and the class tells you how far a reading can stray. For a before-and-after comparison, any meter used the same way both times is accurate enough, while a number you’ll show someone else calls for a Type 2 or Type 1 instrument.
The ANSI S1.4 standard, as NIOSH’s researchers quote it, puts the expected total allowable error for steady broadband noise at about plus or minus 1.5 dB for a Type 1 instrument and plus or minus 2.3 dB for a Type 2.
NIOSH’s 2014 paper adds that US standards and regulations for workplace and environmental noise call for Type 2 instruments, and that OSHA treats a Type 2 meter as accurate to plus or minus 2 dBA. HUD’s Noise Guidebook calls Type 1 meters the precision class, the most accurate and also the most expensive.
Calibration is the other half of accuracy. HUD’s guidebook says the meter must be calibrated before each use, and NIOSH’s researchers calibrated every microphone with an acoustic calibrator before and after each measurement (HUD).
That’s why an inexpensive handheld meter that claims no class still works for this test. Because the test subtracts two readings taken minutes apart on the same meter, a meter that reads a steady 2 dB high in both rooms still gives the right difference.
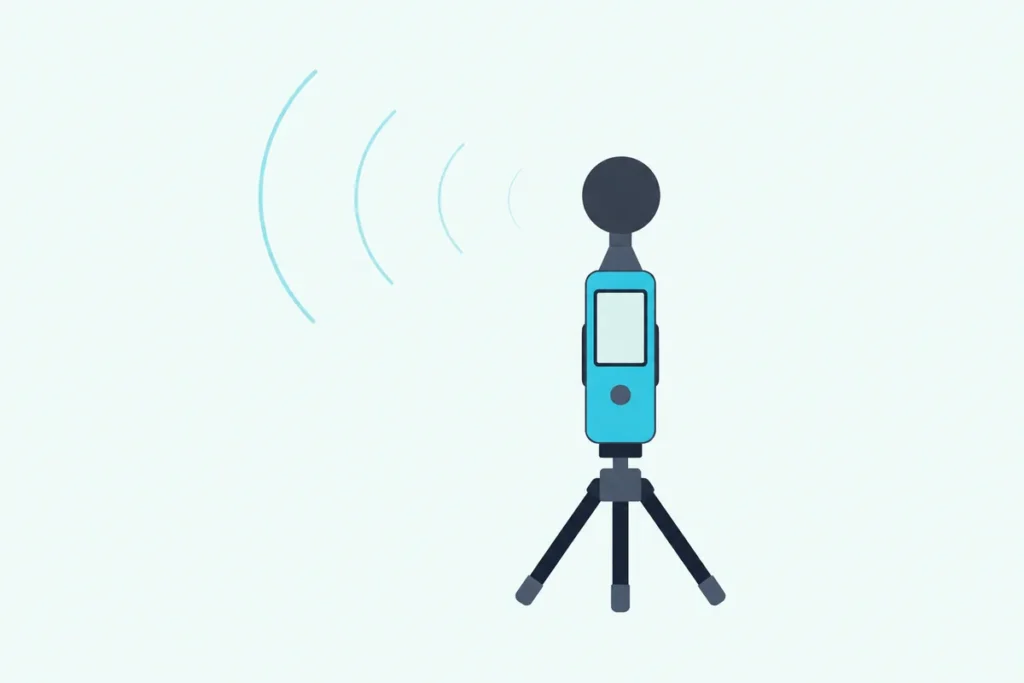
For a meter that keeps those settings fixed, the TopTes TS-501B covers what this test needs. Its listing shows separate A and C weighting, a fast and slow switch and a windscreen ball over a half-inch condenser microphone.
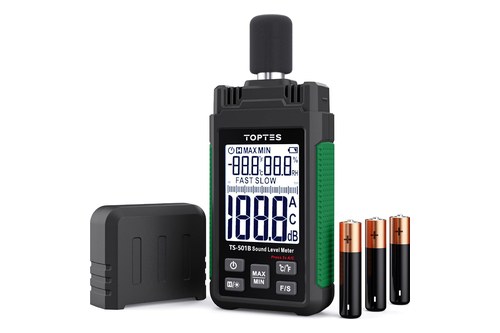
the TopTes TS-501B
The C setting earns its place if bass is part of the complaint, for reasons the bass section below explains. It also ends any doubt about which app or phone was used last time, because the same meter comes out for both tests.
Get Studio Tips Weekly
Join 5,000+ creators getting acoustic treatment advice every week.
No spam. Unsubscribe anytime.Can a Phone App Measure Soundproofing Accurately?
That same-instrument rule matters most with phones, because the microphone, not the app, is the weak point. A phone app can measure soundproofing well enough for a before-and-after comparison if you use the same phone, the same app and the same settings both times, but its absolute numbers can be off by several decibels.
In their 2014 study, NIOSH researchers examined 192 sound apps for iOS and Android and found only four iOS apps whose readings averaged within 2 dB of a reference meter. None of the Android apps met their criteria, which they put down to a fragmented market of devices with different parts and audio hardware (NIOSH via PMC).
Their 2016 follow-up plugged calibrated external microphones into those four iOS apps, and the readings came within about 1 dB of the reference. With the phones’ built-in microphones, the gap between app and reference in the earlier data ran as wide as 14 dB in one direction and 11.3 dB in the other.
The same paper says no smartphone or app had met the ANSI or IEC sound level meter standards. So swapping phones between the before and after tests can move the reading by more than the improvement you’re trying to measure.
How Much Quieter Is a 3, 5 or 10 dB Change?
Those few decibels of app error matter because the improvements people chase are often small numbers. A 3 dB drop is barely perceptible, 5 dB is readily perceptible, and 10 dB sounds half as loud, according to the Federal Highway Administration’s noise fundamentals (FHWA).
| Change in level | How it sounds (FHWA) | Sound energy removed (FHWA) |
|---|---|---|
| 3 dB quieter | Barely perceptible | 50% |
| 5 dB quieter | Readily perceptible | 67% |
| 10 dB quieter | Half as loud | 90% |
| 20 dB quieter | A quarter as loud | 99% |
That table explains a common disappointment: cutting half the sound energy buys only 3 dB, a change most people barely notice. The Navy’s 2005 guidelines for sound insulating homes near airports call a 5 dB reduction generally significant when an existing home is treated.
So if your noise reduction rose by 1 or 2 dB, treat it as no clear change, since that’s smaller than the plus or minus 2.3 dB ANSI S1.4 allows a Type 2 meter. A rise of 5 dB is one you’ll notice, and 10 dB is the change the FHWA calls half as loud.
The same FHWA tables explain the 10 dB background rule from the test steps. Two levels 10 dB or more apart combine to the louder one with nothing added, while two equal levels combine to 3 dB more than either, so a quiet-room reading too close to the background comes out high and shrinks your measured noise reduction.
Decibels don’t add like ordinary numbers, and Burton Acoustix’s decibel calculator shows the sum for two levels side by side.
How Do You Find Where the Sound Is Leaking?
That noise reduction tells you how much the wall and door block together, but not where the rest gets through. To find the leak, keep the test noise playing and move the meter slowly along the door edges, the floor line, outlets, vents and the ceiling joint in the quiet room, watching for spots that read clearly higher than the middle of the room.
Gaps leak far more than their size suggests. HUD’s guidebook says a one-inch square hole, or a 1/16-inch crack 16 inches long, will take a wall rated STC 50 down to STC 40.
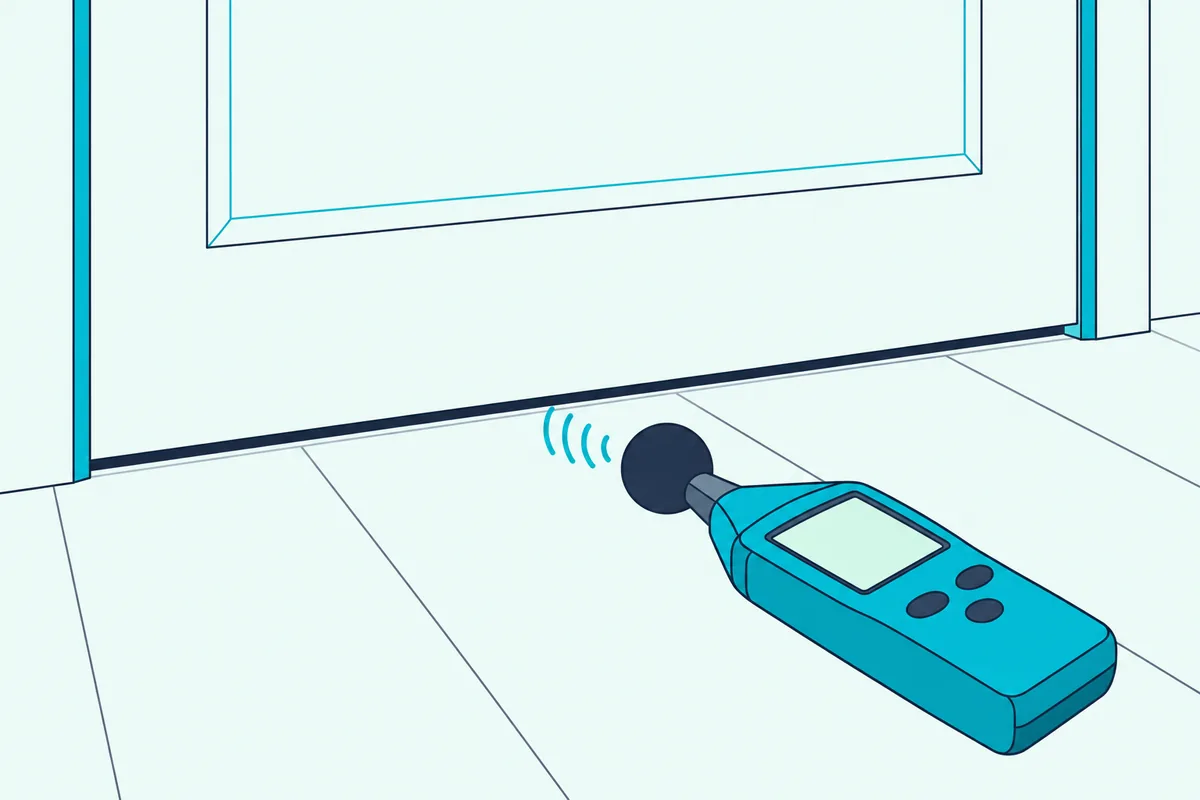
The Navy guidelines call eliminating air gaps, openings and flanking paths the single most important step in noise level reduction, and an occasionally overlooked one. They also note that high frequencies travel best through air gaps, so a hiss or a sharper edge to the sound near the door frame points to a gap.
Flanking is sound that goes around the wall instead of through it. The same guidelines list air ducts, open ceiling or attic spaces, joists and crawl spaces as common paths, so a reading that stays high near a vent or the ceiling corner sends the work there.
If the door turns out to be the loudest spot, start with how to soundproof a leaky door before touching the wall. Then rerun the full two-room test, because a leak fix shows up in the noise reduction, and a wall upgrade can’t show its value while the gap is still open.
Why Does Bass Still Get Through After a Good Result?
Those door gaps mostly leak the higher frequencies, while bass takes a different route through the structure. Bass can still come through after a good test result because A-weighted readings count low frequencies for less, so a meter on the A setting can show a solid noise reduction while the thump of a subwoofer still carries.
HUD’s guidebook describes the A-weighted meter as progressively less sensitive below 1,000 hertz, somewhat as the ear is. The Navy guidelines add that A-weighted levels rest more on middle and high frequencies, that the single-number STC was built around office noise and speech, and that a rating called OITC includes the lower frequencies of transportation noise.
They also note that low-frequency sound passes most easily through lightweight elements such as walls, roofs, doors and windows. That’s why sealing a gap can lift a speech result and leave the bass much the same.
If bass is the problem, run the whole test a second time on the C setting, which NIOSH’s researchers group with the unweighted settings. Play a bass-heavy test track at a fixed volume, and compare C readings only with C readings.
Fixing bass is its own project, and our guide to bass that a dBA reading underplays covers what moves those numbers.
How Do You Test Footstep and Impact Noise?
Footsteps are a third kind of problem, and the two-room speaker test can’t measure them. Impact noise is tested with a standardized tapping machine on the floor above, and Intertek’s summary of the field impact method has it run at four floor positions while microphones read four positions in the room below.
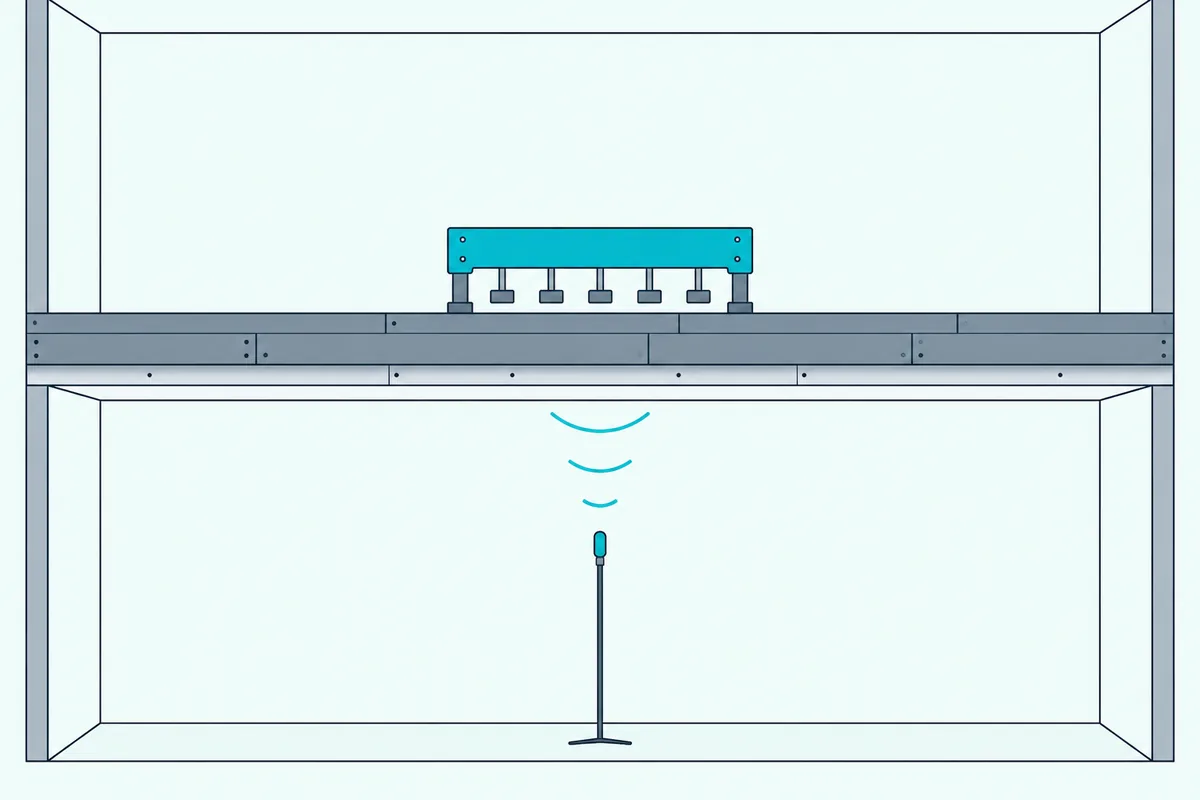
That field test reports impact sound pressure levels from 100 to 3,150 hertz and turns them into single-number ratings such as the AIIC. The laboratory version produces the familiar IIC, and Intertek describes its chambers as set up so the floor sample is the only significant path between the rooms.
Without a tapping machine, any footstep check you run yourself is a rough comparison at best. One way to keep it fair is the same person walking the same path in the same shoes, with the meter on MAX hold at one marked spot in the room below, before and after the work.
For the fixes that lower those numbers, our guide on how to reduce noise from upstairs neighbors starts with the floor above.
How Do Professionals Test Soundproofing?
That tapping machine belongs to one of three ASTM field methods, which between them cover walls, facades and floors. Professionals test soundproofing with a standardized sound source and measurements averaged across positions and frequency bands, then report the result as one of a handful of ratings.
| What’s tested | Method | How it’s done (per Intertek) | Ratings on the report |
|---|---|---|---|
| A wall or floor between two rooms | ASTM E336 | Broadband noise in one room, averaged levels in both | NIC, NNIC, ASTC |
| A facade, window or door to outside | ASTM E966 | A loudspeaker outside at 45 degrees, levels outside and in | ASTC, AOITC, OINIC |
| Footstep noise through a floor | ASTM E1007 | A tapping machine above, microphones below | ISR, NISR, AIIC |
The airborne sound test reports its results across the 125 to 4,000 hertz bands, and Intertek notes that only whole partitions can be tested. A door or window in the wall is measured as part of it, never on its own.
Each rating answers a slightly different question. NIC rates the plain noise reduction with the receiving room as it is, NNIC normalizes it for an unfurnished room, and ASTC uses the room’s sound absorption and the partition’s area to estimate how the wall itself performs as built.
You’ll also meet an older label on past reports. HGC Engineering’s field report for the wall-form maker Nudura explains that results measured under the 1997 edition of the method were written FTL and FSTC, the F standing for field-measured.
Your two-room test is the NIC idea with simpler gear, and its noise reduction behaves the same way. That’s why the furniture had to stay put between tests, since the receiving room’s sound absorption changes the number.
Why Do Field Tests Score Lower Than the STC Rating?
Those field ratings usually land below the laboratory STC printed on a product sheet, and the gap isn’t a sign the product was mislabeled. A field test scores lower because a laboratory is set up so the test specimen is the only significant path for sound, as Intertek describes its chambers, while a finished room adds gaps, outlets, ducts and joists that carry sound around it.
Even careful field work runs a little low. HGC Engineering’s report says field values are commonly 2 to 3 dB below laboratory measurements of the same assembly, because conditions in a building are less ideal than in a lab.
Poor installation costs far more. The General Services Administration’s acoustics guide says it isn’t unusual for a measured NIC to come in ten points or more below the STC, blaming improper installation and ineffective detailing (GSA).
That’s the same crack-and-flanking story from the leak hunt, now with a rating attached. The STC itself is built from sound transmission loss measured band by band, and our page on STC and IIC ratings decoded explains what those laboratory numbers do and don’t cover.
So read a published STC as the best case for an assembly built perfectly. Your own before-and-after noise reduction is the number that says what the work did in your building.
When Is a Certified Sound Test Worth the Cost?
That home number is enough to choose your next fix, but some situations need a result someone else will accept. A certified test is worth the cost when a building code, a contract or a dispute depends on the number, because then the method, the instruments and the tester’s records all have to pass scrutiny.
Intertek notes that most building codes don’t require field certification, yet the IBC and IRC use the ASTC and AIIC ratings for walls and floor-ceilings between units in multifamily buildings, which covers many apartment and condo buildings. Green building programs such as LEED, school acoustics guidelines and the FGI guidelines for health care buildings can also call for field measurements to meet their requirements.
The GSA’s guide goes further for its own offices. It recommends making sound testing of installed partitions part of the installation contract, with any shortfall corrected right away.
A certified report also brings frequency detail a basic handheld meter doesn’t. Firms that offer sound insulation testing, Intertek among them, list the result band by band from 125 to 4,000 hertz, which shows whether a wall falls short at speech frequencies or only lower down, information a single dBA number hides.
The Bottom Line
All of those methods come back to the same subtraction. To test soundproofing, measure the difference between two rooms with a steady broadband noise, using the same speaker spot, the same meter spots and the same meter both times, then write everything down and repeat after the work.
Read a 3 dB change as barely noticeable, 5 dB as clearly better and 10 dB as half as loud, and treat anything under 2 dB as noise in the measurement. When a code, a contract or a neighbor dispute needs the number, hire an acoustical consultant who tests to the ASTM field methods.
Frequently Asked Questions
Can I test soundproofing with my phone?
Yes, for a comparison, as long as you use the same phone and app for the before and after tests. NIOSH’s researchers found only four of 192 apps averaged within 2 dB of a reference meter, all of them on iOS, and none of the Android apps met their criteria. With calibrated external microphones, the best iOS apps came within about 1 dB. For a number you’ll show a landlord or a builder, use a sound level meter, and for a certified result, hire a tester.
How much is a 10 dB reduction?
A 10 dB reduction sounds about half as loud, according to the Federal Highway Administration, and removes 90% of the sound energy. That’s a large improvement for a home project, since the Navy’s guidelines for homes near airports call a 5 dB reduction generally significant. By comparison, a 3 dB drop removes half the energy but is barely perceptible.
Does rockwool soundproof a wall?
Inside a wall cavity it can help. HUD’s Noise Guidebook says isolation blankets of mineral or rock wool, fiberglass and similar materials in a wall’s airspace can attenuate noise by as much as 10 dB, mainly in lightweight construction. Panels hung on a room’s surface are sound absorption, which the Navy’s guidelines say has no direct relationship with a building’s noise level reduction. Running the two-room test before and after the insulation goes in shows what it did in your wall.
What is the difference between NIC and STC?
STC is a laboratory rating for a partition assembly, while NIC is a noise reduction measured from room to room in a real building, so it includes the gaps, flanking paths and furnishings of that building. The GSA’s acoustics guide says NIC can come in ten points or more below the STC when installation and detailing fall short.
How do you check soundproofing without a meter?
Play a steady noise in the next room and walk slowly along the door edges, outlets, vents and floor line, listening for spots where the sound gets sharper or louder. The Navy guidelines note that high frequencies travel best through air gaps, so a hiss near a frame usually means a gap. Your ears can find a leak, but they can’t tell you by how many decibels a fix helped, so use a meter for the before and after numbers.